The Gallup Pakistan digital analytics team is proud to present our cutting-edge sentiment analysis model, meticulously developed to assess the sentiment of news headlines. This project showcases our expertise in sentiment analysis, machine learning, and natural language processing, emphasizing our commitment to harnessing the power of AI for insightful data analysis.
Input Data for this Analysis
Our sentiment analysis model uses a simple yet effective input format: a CSV file containing three main columns—date, headlines, and news outlets. This straightforward structure enables us to efficiently process and analyze a vast array of headlines from multiple news sources over a specified time period. It also facilitates comparative analysis, allowing us to examine how different news outlets report on various events and issues in terms of sentiment.
1. Text Preprocessing
The first step in our sentiment analysis process involves comprehensive text preprocessing. This crucial phase prepares the raw headlines for analysis. We begin with tokenization, breaking down each headline into individual words or tokens. This is followed by lemmatization, where tokens are reduced to their base or root form. For example, “running” becomes “run.” This step ensures that variations of a word are analyzed uniformly.
2. Sentiment Analysis with TextBlob and VADER
For sentiment analysis, we employed two powerful tools: TextBlob and VADER (Valence Aware Dictionary and sEntiment Reasoner). TextBlob provides both polarity and subjectivity scores. Polarity scores range from -1 (negative) to 1 (positive), indicating the sentiment’s nature. Subjectivity scores range from 0 (objective) to 1 (subjective), reflecting the extent to which personal opinions and feelings influence the headline.
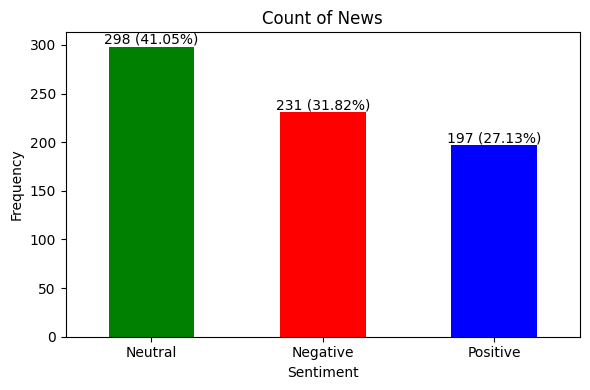
VADER, on the other hand, is particularly effective for analyzing social media texts but also performs well with news headlines. It provides a compound score that ranges from -1 (extremely negative) to 1 (extremely positive). VADER also categorizes sentiment into positive, negative, and neutral scores, offering a nuanced view of the sentiment distribution.
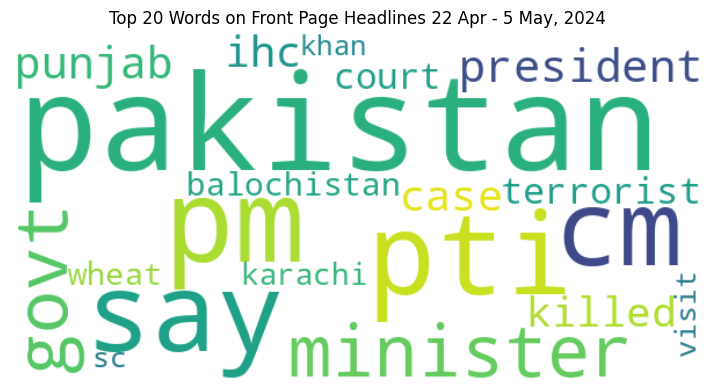
3. Visualization with Word Cloud
To visualize the frequency and significance of words in the headlines, we created word clouds. This graphical representation highlights the most commonly occurring words, with the size of each word indicating its frequency. This visualization helps in quickly identifying prevalent themes and topics within the news headlines.
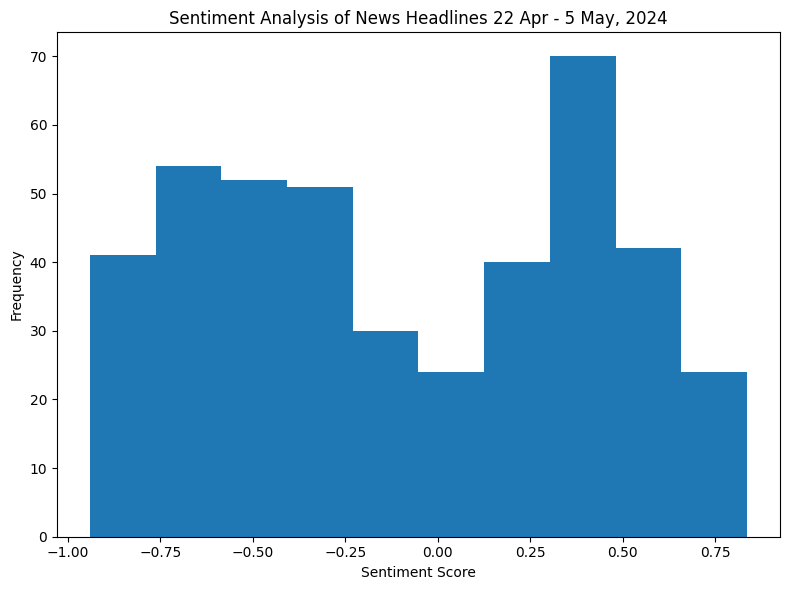
4. Distribution of Sentiment Scores
We also analyzed the distribution of sentiment scores to understand the overall sentiment trend. By plotting the polarity and subjectivity scores from TextBlob and the compound scores from VADER, we can visualize the sentiment landscape of the news headlines. This distribution analysis helps in identifying patterns, such as whether certain topics tend to have more positive or negative coverage.
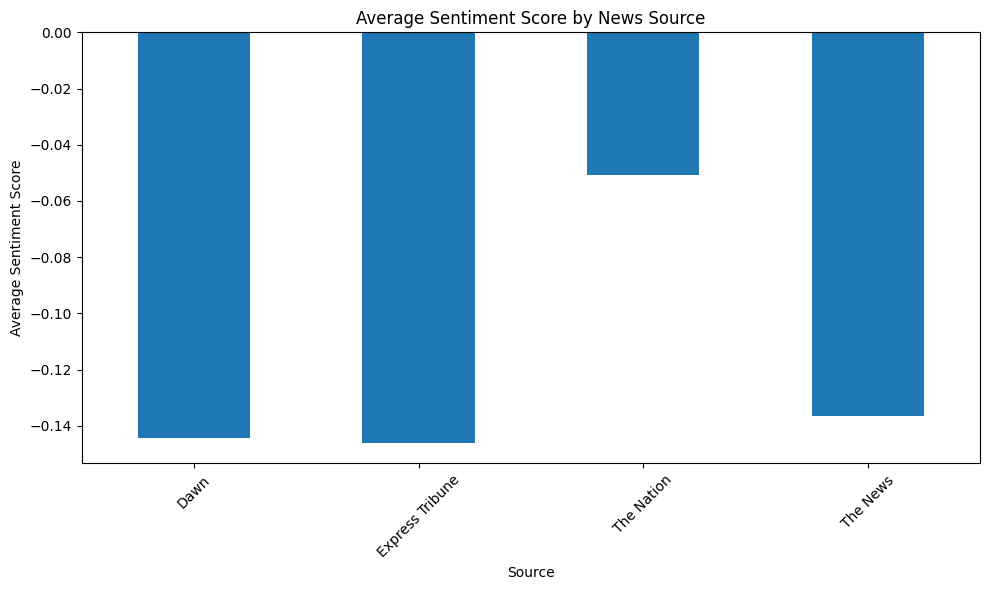
5. Comparative Analysis
One of the standout features of our sentiment analysis model is its ability to facilitate comparative analysis of news sentiment across different outlets. By examining sentiment scores over specific time periods, we can compare how various news organizations report on the same events. This analysis can reveal biases, trends, and differences in reporting styles, providing valuable insights into the media landscape.
From meticulous text preprocessing to sophisticated sentiment scoring and insightful visualizations, our model showcases a comprehensive approach to understanding the sentiment behind news headlines. This project not only demonstrates our technical capabilities but also underscores our dedication to leveraging AI for meaningful data analytics. By focusing on sentiment analysis, we offer a powerful tool for analyzing and comparing news sentiments across different media outlets.
Check out our Project on GitHub