

Mapping Educational Access: Pakistan School Atlas
September 28, 2026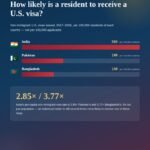
Per-Capita Visa Access: South Asia Compared
September 29, 2026Applications vs. Approvals US visa: The Real Per-Capita Visa Gap in South Asia
Finding: India applies at roughly 2x the per-capita rate of Pakistan and Bangladesh — then gets approved at nearly double their rate on top of that.
(Quick disclaimer: this is pro-bono, independent analysis
Errors are always possible with this kind of quick-turnaround work, and we’d genuinely welcome corrections. The goal isn’t a definitive answer — it’s to put real numbers on the table and start a debate.)
Yesterday we shared that India receives 2.85–3.77x more non-immigrant U.S. visas per capita than Pakistan and Bangladesh, even after correcting for population. Several of you pushed back with a fair challenge: “issued visas only tell you who got approved — what about who actually applied?”
So here’s what we did. The State Department publishes adjusted refusal rates by nationality every fiscal year. Refusal rate = refused ÷ applied, so:
Applications = Issued ÷ (1 − Refusal Rate)
We matched FY2024 and FY2025 refusal rates against same-year visa issuance for India, Pakistan, and Bangladesh, and normalized everything per capita.
The gap shrinks — but doesn’t disappear:
📊 Visas issued per 100,000 (2025): India 74 | Pakistan 20 | Bangladesh 15
📋 Applications per 100,000 (2025): India 95 | Pakistan 41 | Bangladesh 40
India’s advantage over Pakistan drops from 3.77x (issued) to 2.30x (applications). Over Bangladesh, 4.86x becomes 2.40x. Roughly half of India’s apparent edge was a refusal-rate effect, not an application-rate gap — Indians apply at about 2x the rate of their neighbors, then get approved at a much higher rate on top of that (78% vs. 48% for Pakistan, 39% for Bangladesh).
Year-over-year made it starker. All three countries saw issuance collapse from FY2024 to FY2025 — India -48%, Pakistan -67%, Bangladesh -68% — hitting Pakistan and Bangladesh’s per-capita application rates far harder (-63% and -55%) than India’s (-44%), while Bangladesh’s refusal rate alone jumped 15 points.
So why the underlying application-rate gap in the first place? A few hypotheses, none provable from visa stats alone but all plausible:
Economic integration — India’s IT/services sector has spent 25+ years building direct U.S. business pipelines (H-1B pathways, global capability centers), generating the kind of well-documented, easy-to-approve travel that Pakistan and Bangladesh’s export economies
Ability to self-fund and document — B1/B2 approval requires showing financial capacity and ties back home. A larger affluent/upper-middle class in absolute numbers likely helps explain?
Process friction and familiarity — consular post density, documentation ecosystems, and referral networks from prior successful applicants can lower friction for the next person, in ways that don’t show up in refusal-rate statistics.
A population that can move, work, and study in the U.S. more easily has a structural advantage that compounds across generations.