Building a Unified Market: How Better Transport Helps Reduce Wheat Price Gaps
June 2, 2025
Mouza Census Reveals Stark Gaps in Rural Access to Government Piped Water
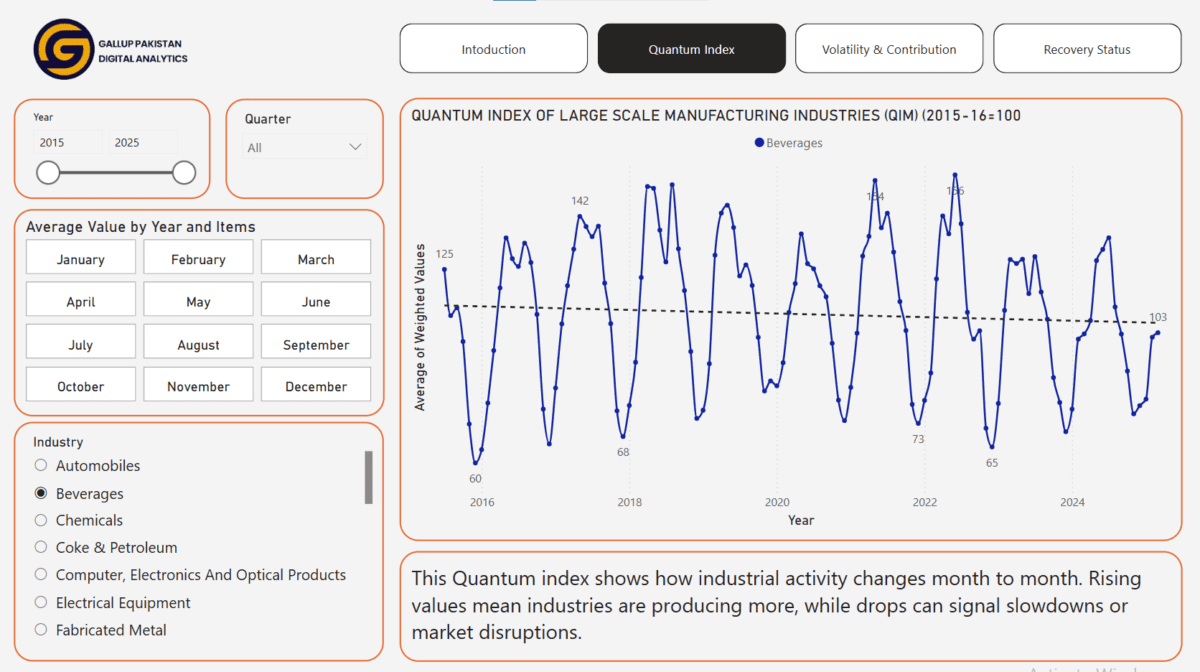
July 11, 2025Over the last ten years, the beverage industry in Pakistan has shown clear patterns that reflect our changing weather and economic events. In summer months, sales of soft drinks, juices, and bottled water rise noticeably. In winter, however, demand dips as people prefer warm beverages and stay indoors. These seasonal trends are very visible in manufacturing data.
The Covid-19 downturn also left a mark on this industry. When lockdowns and social distancing began in 2020, factories reduced output because restaurants and cafes were closed. Consequently, the production of beverages fell sharply in that period. More recently, in 2024, there was another notable dip in performance. Rising costs, supply chain issues, and economic uncertainties have all contributed to that decline.
At Gallup Pakistan Digital Analytics, we have digitized and visualized the Quantum Index of Manufacturing (QIM) data. The QIM measures how each part of the manufacturing sector performs every month. By turning this raw data into clear charts, we can see exactly how the beverage industry has changed over time.
Our dashboard not only shows beverage production trends but also covers 30+ other industrial sectors. You can explore sectors like textiles, cement, food, and chemicals. Each sector’s line or bar graph shows peaks, spikes, and dips. For example, while beverages dip in winter, cement might rise as construction picks up.
If you want to study how industries in Pakistan respond to seasons, crises, or policy changes, this dashboard is a valuable tool. Students, researchers, business owners, and policymakers can all benefit. By tracking these trends, you can make informed decisions—whether that means investing in a factory, planning for supply needs, or setting government policies to support manufacturers.
👉 Explore the full Quantum Index dashboard here:
https://galluppakistandigitalanalytics.com/quantum-index-large-scale-manufacturing/